TensorFlow数据可视化

代码

1
2
3
4
5
6
7
8
9
10
11
12
13
14
15
16
17
18
19
20
21
22
23
24
25
26
27
28
29
30
31
32
33
34
35
36
37
38
39
40
41
42
43
44
45
46
47
48
49
50
51
52
53
54
55
56
57
58
59
60
61
#!/usr/bin/env python
# -*- coding: utf-8 -*-
# @Time : 2018/9/7 16:59
# @Author : Seven
# @Site :
# @File : demo.py
# @Software: PyCharm

import numpy as np
import tensorflow as tf

n_observations = 100
xs = np.linspace(-3, 3, n_observations)
ys = 0.8*xs + 0.1 + np.random.uniform(-0.5, 0.5, n_observations)

X = tf.placeholder(tf.float32, name='X')
Y = tf.placeholder(tf.float32, name='Y')

W = tf.Variable(tf.random_normal([1]), name='weight')
tf.summary.histogram('weight', W)
b = tf.Variable(tf.random_normal([1]), name='bias')
tf.summary.histogram('bias', b)


Y_pred = tf.add(tf.multiply(X, W), b)

loss = tf.square(Y - Y_pred, name='loss')
tf.summary.scalar('loss', tf.reshape(loss, []))

learning_rate = 0.01
optimizer = tf.train.GradientDescentOptimizer(learning_rate).minimize(loss)

n_samples = xs.shape[0]
init = tf.global_variables_initializer()
with tf.Session() as sess:
# 记得初始化所有变量
sess.run(init)
merged = tf.summary.merge_all()
log_writer = tf.summary.FileWriter("./logs/linear_regression", sess.graph)

# 训练模型
for i in range(50):
total_loss = 0
for x, y in zip(xs, ys):
# 通过feed_dic把数据灌进去
_, loss_value, merged_summary = sess.run([optimizer, loss, merged], feed_dict={X: x, Y: y})
total_loss += loss_value

if i % 5 == 0:
print('Epoch {0}: {1}'.format(i, total_loss / n_samples))
log_writer.add_summary(merged_summary, i)

# 关闭writer
log_writer.close()

# 取出w和b的值
W, b = sess.run([W, b])

print(W, b)
print("W:"+str(W[0]))
print("b:"+str(b[0]))

执行结果

1
2
3
4
5
6
7
8
9
10
11
12
13
Epoch 0: [0.5815637]
Epoch 5: [0.08926834]
Epoch 10: [0.08926827]
Epoch 15: [0.08926827]
Epoch 20: [0.08926827]
Epoch 25: [0.08926827]
Epoch 30: [0.08926827]
Epoch 35: [0.08926827]
Epoch 40: [0.08926827]
Epoch 45: [0.08926827]
[0.7907032] [0.10920969]
W:0.7907032
b:0.10920969

Tensoboard

在终端执行代码:

1
tensorboard --logdir log (你保存文件所在位置)

输出:

1
TensorBoard 0.4.0 at http://seven:6006 (Press CTRL+C to quit)
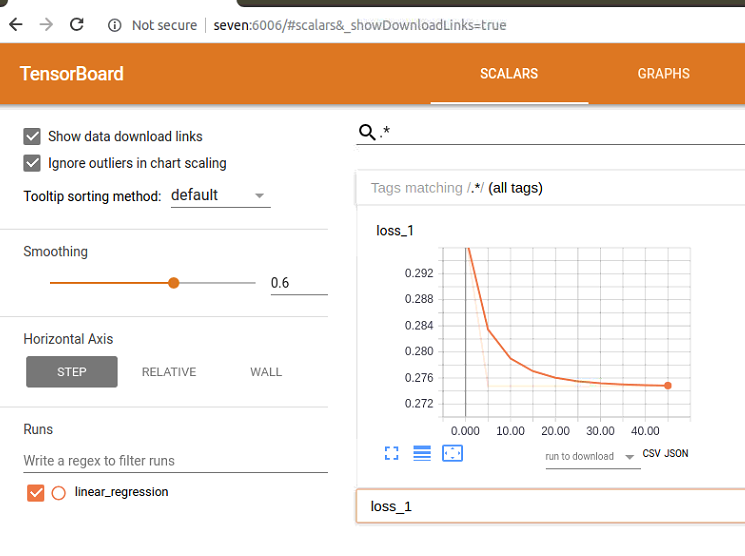
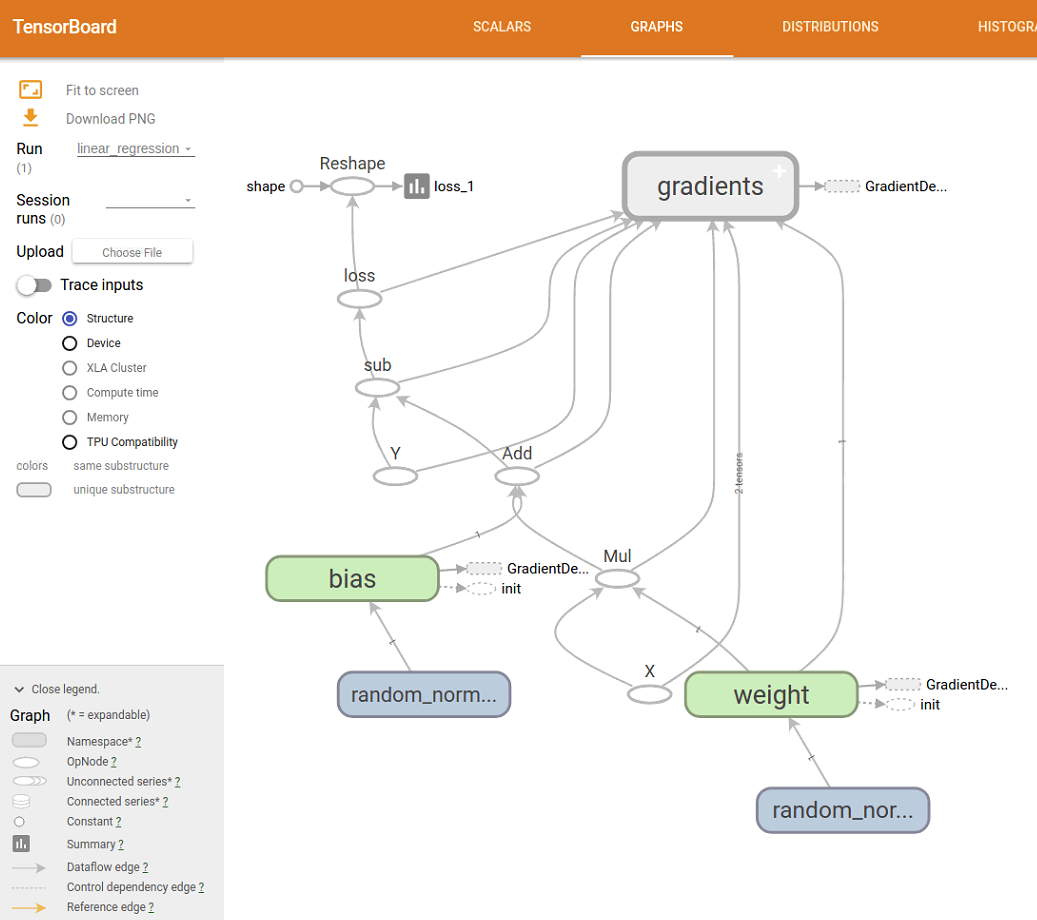
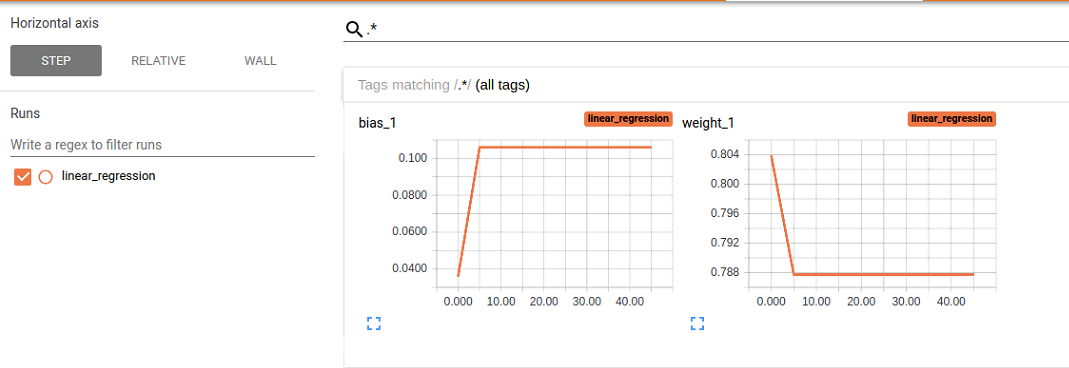
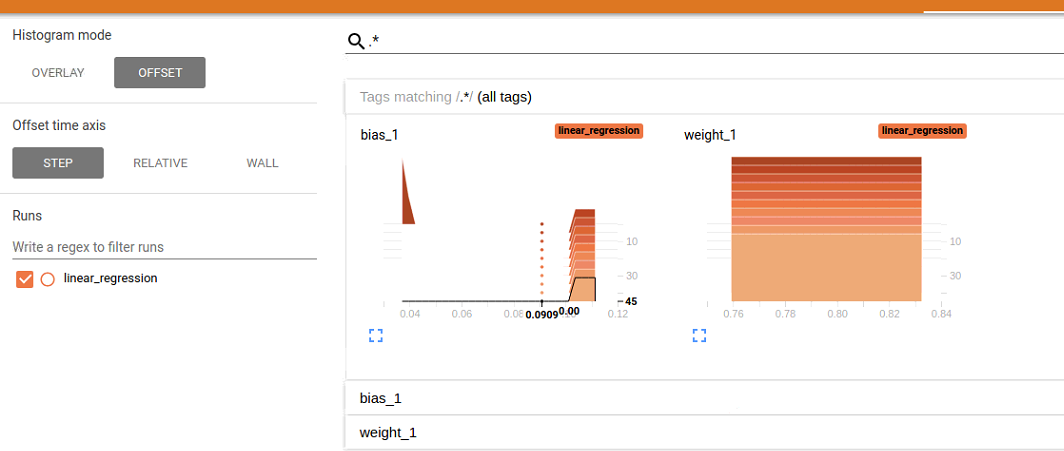
然后打开网页:http://seven:6006

显示结果:

image

image

image

image

转载请注明:Seven的博客

本文标题:TensorFlow数据可视化

文章作者:Seven

发布时间:2018年09月07日 - 00:00:00

最后更新:2018年12月11日 - 22:13:44

原始链接:http://yoursite.com/2018/09/07/2018-09-07-TensorFlow-visualization/

许可协议: 署名-非商业性使用-禁止演绎 4.0 国际 转载请保留原文链接及作者。

------ 本文结束------
坚持原创技术分享,您的支持将鼓励我继续创作!
0%